CentOS7 Cisco TRex利用方法 その1
Cisco TRexのセットアップから利用方法について記載します。
また、実用面を考慮し、PingやPcap方法についても記載します。
1.環境
1-1.VMWare
筐体                             : 自作PC(Win10pro)
CPU                           : Intel(R) Core(TM) i9-9900K CPU @ 3.60GHz
VMWare              : VMware(R) Workstation 15 Pro 15.5.6 build-16341506
OS                               : CentOS7.7
TRex                             : v2.82
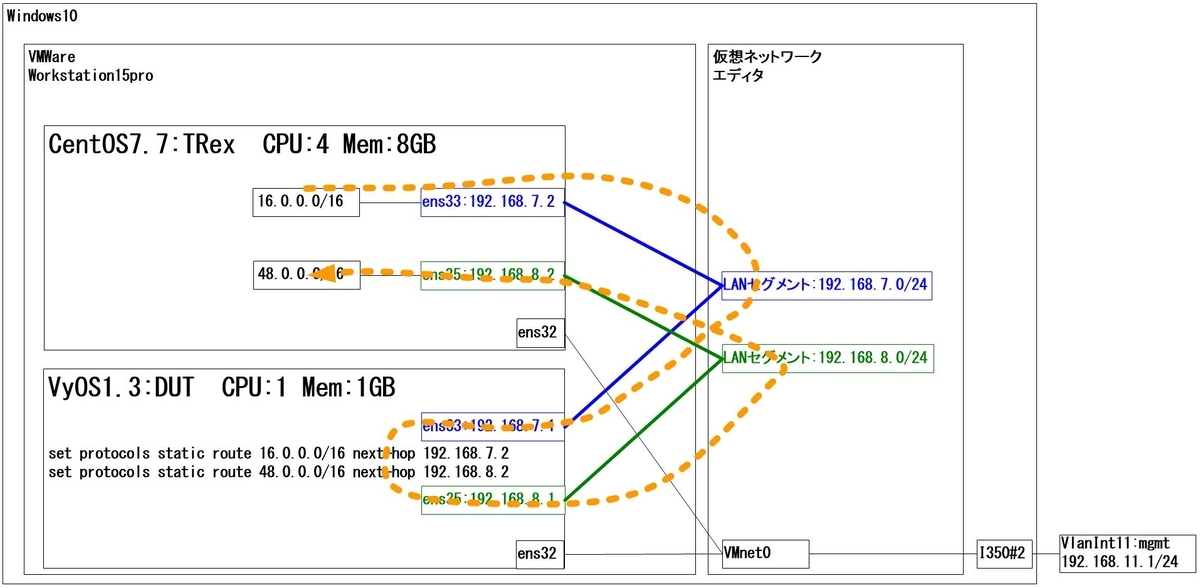
1-2.全体構成
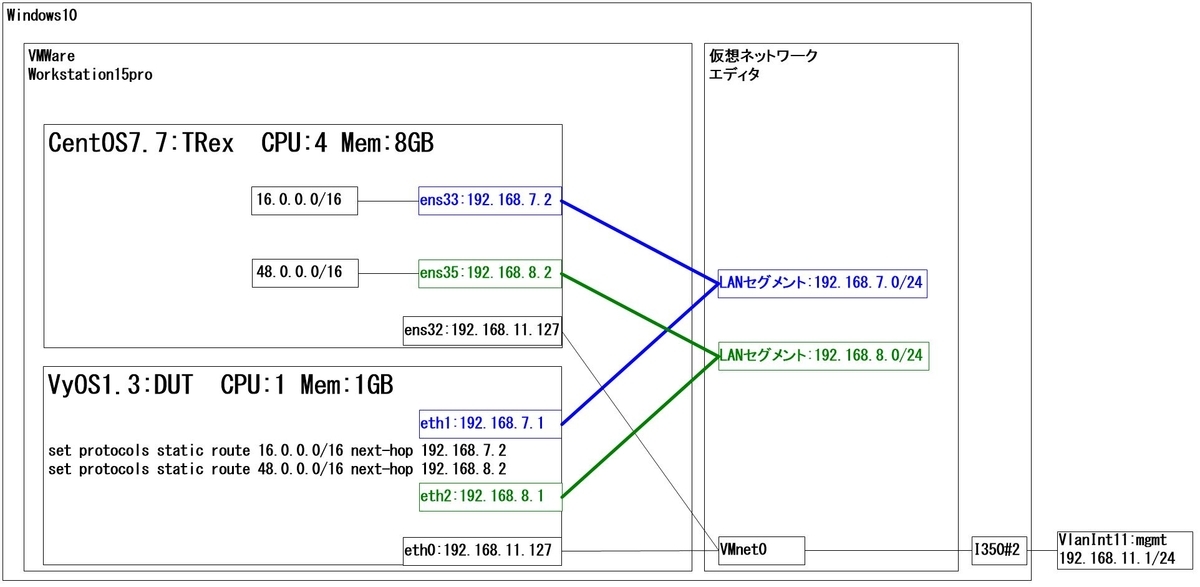
ベアメタル環境でも構築可能です。
2.インストール手順と事前準備
全体構成図に記載したようなNWを構築しておいてください。
TRexとDUT間でPing疎通が確認できるところまでは各自で実施してください。
TRexはDPDKを利用して動作しますので、KernelからDPDKにNICの制御が委譲されると、bash上ではIPアドレスなどの確認操作ができなくなります。*1
2-1.TRexのインストール
tar.gzファイルをDLして任意のディレクトリに展開するだけです。
ここでは以下のコマンドにより、TRex環境を構築しました。
以降は、/root/trex配下にて作業を行います。
mkdir -p /opt/trex && \
cd /opt/trex && \
wget --no-check-certificate --no-cache https://trex-tgn.cisco.com/trex/release/v2.82.tar.gz && \
tar -xzvf v2.82.tar.gz && \
ln -s /opt/trex/v2.82 /root/trex && \
cd /root/trex
2-2.事前準備
以下のコマンドにより、DPDKで使用するPortのIP設定を行っていきます。
./dpdk_setup_ports.py -i
出力例
[root@c77g127 trex]# ./dpdk_setup_ports.py -i
By default, IP based configuration file will be created. Do you want to use MAC based config? (y/N) Enter
+----+------+---------+-------------------+----------------------------------------------+--------+----------+----------+
| ID | NUMA |   PCI   |        MAC        |                     Name                     | Driver | Linux IF |  Active  |
+====+======+=========+===================+==============================================+========+==========+==========+
| 0  | -1   | 02:00.0 | 00:0c:29:12:ff:5a | 82545EM Gigabit Ethernet Controller (Copper) | e1000  | ens32    | *Active* |
+----+------+---------+-------------------+----------------------------------------------+--------+----------+----------+
| 1  | -1   | 02:01.0 | 00:0c:29:12:ff:64 | 82545EM Gigabit Ethernet Controller (Copper) | e1000  | ens33    |          |
+----+------+---------+-------------------+----------------------------------------------+--------+----------+----------+
| 2  | -1   | 02:03.0 | 00:0c:29:12:ff:6e | 82545EM Gigabit Ethernet Controller (Copper) | e1000  | ens35    |          |
+----+------+---------+-------------------+----------------------------------------------+--------+----------+----------+
Please choose even number of interfaces from the list above, either by ID , PCI or Linux IF
Stateful will use order of interfaces: Client1 Server1 Client2 Server2 etc. for flows.
Stateless can be in any order.
Enter list of interfaces separated by space (for example: 1 3) : 1 2

For interface 1, assuming loopback to it's dual interface 2.
Putting IP 1.1.1.1, default gw 2.2.2.2 Change it?(y/N).y
Please enter IP address for interface 1: 192.168.7.2
Please enter default gateway for interface 1: 192.168.7.1
For interface 2, assuming loopback to it's dual interface 1.
Putting IP 2.2.2.2, default gw 1.1.1.1 Change it?(y/N).y
Please enter IP address for interface 2: 192.168.8.2
Please enter default gateway for interface 2: 192.168.8.1
Print preview of generated config? (Y/n) Enter
### Config file generated by dpdk_setup_ports.py ###

- version: 2
  interfaces: ['02:01.0', '02:03.0']
  port_info:
      - ip: 192.168.7.2
        default_gw: 192.168.7.1
      - ip: 192.168.8.2
        default_gw: 192.168.8.1

  platform:
      master_thread_id: 0
      latency_thread_id: 1
      dual_if:
        - socket: 0
          threads: [2,3]


Save the config to file? (Y/n) Enter
Default filename is /etc/trex_cfg.yaml
Press ENTER to confirm or enter new file:
Saved to /etc/trex_cfg.yaml.
2-3.設定ファイルのチューニング
/etc/trex_cfg.yamlに設定ファイルが格納されています。
そこそこ大きな負荷をかける場合(例えば、10万CPS以上)、メモリが不足する場合があるため追加しておきます。
2020/12/20追記
dest_mac: にてdefault_gwのMACアドレスを追記しました。
これはarp処理に失敗して負荷が掛けられないことがあった際、その対処方法として、とても有効だったため追記しました。
vi /etc/trex_cfg.yaml

[root@c77g127 trex]# vi /etc/trex_cfg.yaml

### Config file generated by dpdk_setup_ports.py ###

- version: 2
  interfaces: ['02:01.0', '02:03.0']
  memory:
     dp_flows: 4048576
  port_info:
      - ip: 192.168.7.2
        default_gw: 192.168.7.1
        dest_mac: '00:00:00:01:00:00'
      - ip: 192.168.8.2
        default_gw: 192.168.8.1
        dest_mac: '00:00:00:02:00:00'

  platform:
      master_thread_id: 0
      latency_thread_id: 1
      dual_if:
        - socket: 0
          threads: [2,3]
3.簡易負荷試験
細かい説明は後述しますので、とりあえず、トラフィックを印加してみます。
3-1.DNSトラフィック印加
デフォルトで入っている ./cap2/dns.yamlファイルを利用し、30秒間、multiplierレート×1倍にて、DNSトラフィックを印加します。
./t-rex-64 -f ./cap2/dns.yaml -d 30 -m 1
出力例
[root@c77g127 trex]# ./t-rex-64 -f ./cap2/dns.yaml -d 30 -m 1

-Per port stats table
      ports |               0 |               1
 -----------------------------------------------------------------------------------------
   opackets |              29 |              29
     obytes |            2233 |            2697
   ipackets |              28 |              29
     ibytes |            2053 |            1973
    ierrors |               0 |               0
    oerrors |               0 |               0
      Tx Bw |     588.91  bps |     711.29  bps

-Global stats enabled
 Cpu Utilization : 0.1  %
 Platform_factor : 1.0
 Total-Tx        :       1.30 Kbps
 Total-Rx        :     776.93  bps
 Total-PPS       :       1.91  pps
 Total-CPS       :       0.96  cps

 Expected-PPS    :       2.00  pps
 Expected-CPS    :       1.00  cps
 Expected-BPS    :       1.36 Kbps

 Active-flows    :        0  Clients :      511   Socket-util : 0.0000 %
 Open-flows      :       29  Servers :      255   Socket :       13 Socket/Clients :  0.0
 drop-rate       :     523.27  bps
 current time    : 31.3 sec
 test duration   : 0.0 sec
30秒間経過すると以下のように統計情報が出力されます。
~一部省略~
 Cpu Utilization : 0.1  %
 Platform_factor : 1.0
 Total-Tx        :     631.23  bps
 Total-Rx        :     834.98  bps
 Total-PPS       :       0.93  pps
 Total-CPS       :       0.46  cps

 Expected-PPS    :       2.00  pps
 Expected-CPS    :       1.00  cps
 Expected-BPS    :       1.36 Kbps

 Active-flows    :        0  Clients :      511   Socket-util : 0.0000 %
 Open-flows      :       29  Servers :      255   Socket :        0 Socket/Clients :  0.0
 drop-rate       :       0.00  bps
 summary stats
 --------------
 Total-pkt-drop       : 0 pkts
 Warning : number of rx packets exceeds 101% of tx packets!
 Total-tx-bytes       : 4930 bytes
 Total-tx-sw-bytes    : 0 bytes
 Total-rx-bytes       : 4112 byte

 Total-tx-pkt         : 58 pkts
 Total-rx-pkt         : 59 pkts
 Total-sw-tx-pkt      : 0 pkts
 Total-sw-err         : 0 pkts
 Total ARP sent       : 4 pkts
 Total ARP received   : 2 pkts
3-3.HTTPトラフィック印加
デフォルトで入っている ./cap2/http_simple.yaml ファイルを利用し、30秒間、multiplierレート×1倍にて、HTTPトラフィックを印加します。
./t-rex-64 -f ./cap2/http_simple.yaml -d 30 -m 1
出力例はDNSと同様です。
トラフィックフローとしては以下の通りです。
3-4.yaml設定ファイルの中身
上記の試験で使用した dns.yamlとhttp_simple.yamlの中身を確認してみます。
設定変更の機会が多い箇所を赤文字にしました。
vi ./cap2/dns.yaml

[root@c77g127 trex]# vi ./cap2/dns.yaml

- duration : 10.0
  generator :
          distribution : "seq"
          clients_start : "16.0.0.1"
          clients_end   : "16.0.1.255"
          servers_start : "48.0.0.1"
          servers_end   : "48.0.0.255"
          clients_per_gb : 201
          min_clients    : 101
          dual_port_mask : "1.0.0.0"
          tcp_aging      : 1
          udp_aging      : 1
  cap_info :
     - name: cap2/dns.pcap
       cps : 1.0
       ipg : 10000
       rtt : 10000
       w   : 1
http_simple.yaml
vi ./cap2/http_simple.yaml

[root@c77g127 trex]# vi ./cap2/http_simple.yaml

- duration : 0.1
  generator :
          distribution : "seq"
          clients_start : "16.0.0.1"
          clients_end   : "16.0.0.255"
          servers_start : "48.0.0.1"
          servers_end   : "48.0.255.255"
          clients_per_gb : 201
          min_clients    : 101
          dual_port_mask : "1.0.0.0"
          tcp_aging      : 0
          udp_aging      : 0
  cap_ipg    : true
  cap_info :
     - name: avl/delay_10_http_browsing_0.pcap
       cps : 2.776
       ipg : 10000
       rtt : 10000
       w   : 1
| clients_start | クライアントIP開始アドレス 補足1 |
| clients_ens | クライアントIP終了アドレス 補足1 |
| servers_start | サーバIP開始アドレス 補足1 |
| servers_end | サーバIP終了アドレス 補足1 |
| name | pcapファイルへのパス 補足2 |
| cps | connection per seconds 補足3 |
<補足1>
DUT側のRouting設定に依存しますが、基本的に変える必要はあまりないと思います。
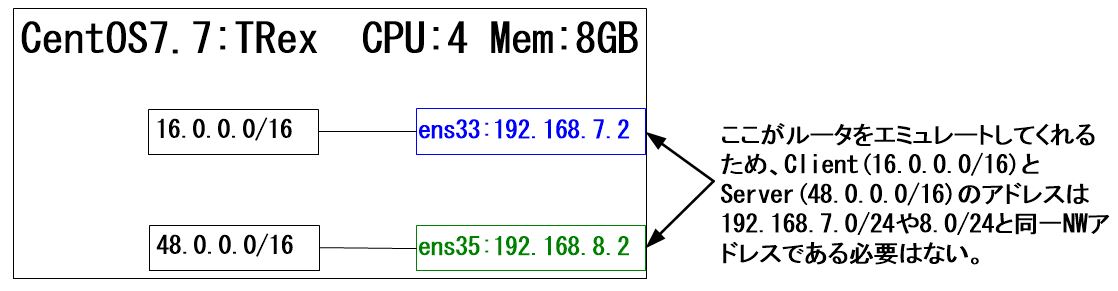
なお、上図に記載の通り、TRexとDUT間のNWアドレス(192.168.7.0/24, 192.168.8.0/24)と同一のNWアドレスにする必要はありません。
むしろ、同一にすべきではないです。
なぜなら、同一にした場合、DUT側にRouting設定を入れなくてもよい、というメリットがある一方、DUTがarpによりアドレス解決をしなければならなくなるため、DUTに無駄な負荷が掛かります。
/24程度であればよいかもしれませんが、/16のアドレス数(65000程度)をarpによりアドレス解決させることは、DUT本来の性能に影響を及ぼす可能性も考えられるからです。
<補足2>
今回の例では、作業ディレクトリは、ln -sにて、/root/trex配下としているため、このパスを起点にして、ファイルパスを記載しています。実際のパスは、/opt/trex/v2.82配下となります。
このため、パスを記載すると以下の通りとなります。
/root/trex/cap2/dns.pcap
/root/trex/avl/delay_10_http_browsing_0.pcap
加えて、よく使うディレクトリを以下に記載します。
| /root/trex/astf | astf(アドバンスドステートフル)モード用Pythonファイル |
| /root/trex/avl | サンプルPcapファイル |
| /root/trex/cap2 | stf(ステートフル)モード用yamlファイル |
| /root/trex/cfg | Trexのサンプルcfgファイル |
| /root/trex/stl | stl(ステートレス)モード用Pythonファイル |
いずれもサンプルファイルがとても充実しているため、時間があるときに一通り確認することを強くお勧めします。
<補足3>
Float型で定義されています。
このCPS値と「3-1.DNSトラフィック印加」に記載した「-m」の値で負荷を調節します。
./t-rex-64 -f ./cap2/http_simple.yaml -d 30 -m 1
例えば、「cps : 10」と「-m 100」であれば、乗算してCPS1000となります。
3-5.yaml設定ファイルのオプション
[root@c77g127 trex]# vi ./cap2/dns.yaml

- duration : 10.0
  generator :
          distribution : "seq"
          clients_start : "16.0.0.1"
          clients_end   : "16.0.1.255"
          servers_start : "48.0.0.1"
          servers_end   : "48.0.0.255"
          clients_per_gb : 201
          min_clients    : 101
          dual_port_mask : "1.0.0.0"
          tcp_aging      : 1
          udp_aging      : 1
  cap_info :
     - name: cap2/dns.pcap
       cps : 1.0
       ipg : 10000
       rtt : 10000
       w   : 1
       server_addr : "48.0.0.7"
       one_app_server : true
       keep_src_port: true
| server_addr | 固定した際に使用するIPアドレスの設定 |
| one_app_server | サーバアドレスを1つに固定する設定 |
| keep_src_port | Pcapファイルから読み込んだL4SrcPortに固定する設定 補足4 |
<補足4>
Defaultはfalseで、Pcapファイルから読み込んだL4SrcPortを無視して、L4SrcPortがランダムに変化します。LBやFWなどコネクション(フロー)を管理しているDUTの場合、CPSが増加するとコネクション数(Concurrent Connection)も増加します。このため、コネクションを増やさずに負荷を増加させたい場合、Pcapファイルから読み込んだL4SrcPortに固定することが可能です。もちろん、SrcIPを固定しても同様の効果が得られるケースであれば問題ありません。しかし、IPアドレス1つあたり、L4SrcPortが最大65535となる=65535Concurrent Connectionとなる可能性があるため、例えば、1000Concurrent Connectionをキープしながら、CPSを増加させたい、といった場合には重宝します。
4.ASTFモード
4-1.各種モードについて
| STL(ステートレス)モード | Pythonファイル | L2L3SWなどに対して一方的にパケットを送り付ける場合に利用します。ストリーミングなどパケットベースのトラフィックを印加。詳細は割愛します。 |
| STF(ステートフル)モード | yamlファイル | 「3.簡易負荷試験」にて実施したモードです。フローベースのトラフィックを印加。DUTにおいて、L7までのインスペクトは可能ですが、TCPや上位レイヤの各種フラグやオプションの書き換えは不可。補足5 |
| ASTF(アドバンスドステートフル)モード | Pythonファイル | 本章で解説します。STFに加えて、DUTがTCPやSSLの終端を行う場合においても、フローベースのトラフィックを印加可能です。 |
<補足5>
「3.簡易負荷試験」にてDNSの試験を実施しましたが、「DNSはUDPだからステートレスではないの?」という疑問が湧くと思いますが、「コネクション型(TCP)/コネクションレス型(UDP, IP)」と「ステートレス/ステートフル」は異なる概念だと考えた方が良いのかなと思います。*2
4-2.ASTFモードによるTRexサーバ起動
ターミナル画面を2つ準備してください。
1つ目のターミナル(Term1とします)で、以下のコマンドにより、ASTFモードで起動します。
Term1にて実行
./t-rex-64 -i --astf

CPUコア数を指定する場合
./t-rex-64 -i --astf -c 14
ベアメタル環境などでCPUコア数が潤沢にある場合、「-c」オプションによりコア数を指定することができます。
<出力例>
[root@c77g127 trex]# ./t-rex-64 -i --astf
Trying to bind to vfio-pci ...
Trying to compile and bind to igb_uio ...
ERROR: We don't have precompiled igb_uio.ko module for your kernel version
Will try compiling automatically...
Success.

/usr/bin/python dpdk_nic_bind.py --bind=igb_uio 0000:02:01.0 0000:02:03.0
The ports are bound/configured.
Starting  TRex v2.82 please wait  ...
 set driver name net_e1000_em
 driver capability  : TCP_UDP_OFFLOAD
 set dpdk queues mode to ONE_QUE
 Number of ports found: 2
zmq publisher at: tcp://*:4500
EAL: Error enabling interrupts for fd 20 (Input/output error)
EAL: Error enabling interrupts for fd 22 (Input/output error)
 wait 1 sec .
port : 0
------------
link         :  link : Link Up - speed 1000 Mbps - full-duplex
promiscuous  : 0
port : 1
------------
link         :  link : Link Up - speed 1000 Mbps - full-duplex
promiscuous  : 0
 number of ports         : 2
 max cores for 2 ports   : 1
 tx queues per port      : 3
 -------------------------------
RX core uses TX queue number 65535 on all ports
 core, c-port, c-queue, s-port, s-queue, lat-queue
 ------------------------------------------
 1        0      0       1       0      0
 -------------------------------

~~~しばらくすると以下の出力になる~~~

-Per port stats table
      ports |               0 |               1
-----------------------------------------------------------------------------------------
   opackets |               0 |               0
     obytes |               0 |               0
   ipackets |               0 |               0
     ibytes |               0 |               0
    ierrors |               0 |               0
    oerrors |               0 |               0
      Tx Bw |       0.00  bps |       0.00  bps

-Global stats enabled
 Cpu Utilization : 0.0  %
 Platform_factor : 1.0
 Total-Tx        :       0.00  bps
 Total-Rx        :       0.00  bps
 Total-PPS       :       0.00  pps
 Total-CPS       :       0.00  cps

 Expected-PPS    :       0.00  pps
 Expected-CPS    :       0.00  cps
 Expected-L7-BPS :       0.00  bps

 Active-flows    :        0  Clients :        0   Socket-util : 0.0000 %
 Open-flows      :        0  Servers :        0   Socket :        0 Socket/Clients :  -nan
 drop-rate       :       0.00  bps
 current time    : 1.8 sec
 test duration   : 0.0 sec
4-3.TRexコンソールへのログイン
もう1つのターミナル画面(Term2とします)から以下のコマンドにより、TRexサーバへコンソールログインします。以下のコマンドは、上述した通り、/root/trex配下で実行してください。
Term2にて実行
./trex-console -s 192.168.11.127
<出力例>
[root@c77g127 trex]# ./trex-console -s 192.168.11.127

Using 'python' as Python interpeter

Connecting to RPC server on 192.168.11.127:4501              [SUCCESS]

Connecting to publisher server on 192.168.11.127:4500        [SUCCESS]

Acquiring ports [0, 1]:                                      [SUCCESS]

Server Info:
Server version:   v2.82 @ ASTF
Server mode:      Advanced Stateful
Server CPU:       1 x Intel(R) Core(TM) i9-9900K CPU @ 3.60GHz
Ports count:      2 x 1Gbps @ 82545EM Gigabit Ethernet Controller (Copper)

-=TRex Console v3.0=-

Type 'help' or '?' for supported actions

trex>
4-4.トラフィック印加
デフォルトで入っている .astf/http_simple.py ファイルを利用し、30秒間、multiplierレート×1倍にて、HTTPトラフィックを印加します。
Term2にて実行
start -f astf/http_simple.py -d 30 -m 1
<出力例>
Term2にて出力
trex>start -f astf/http_simple.py -d 30 -m 1

Loading traffic at acquired ports.                           [SUCCESS]

Starting traffic.                                            [SUCCESS]

59.67 [ms]

trex>
プロンプトが「trex>」に戻ると、印加開始です。
すると、Term1画面にて統計情報が動き始めます。
<出力例>
Term1画面にて出力

-Per port stats table
      ports |               0 |               1
 -----------------------------------------------------------------------------------------
   opackets |              91 |             451
     obytes |           10990 |          609400
   ipackets |             451 |              91
     ibytes |          609400 |           10990
    ierrors |               0 |               0
    oerrors |               0 |               0
      Tx Bw |      13.22 Kbps |     738.66 Kbps

-Global stats enabled
 Cpu Utilization : 0.2  %  0.7 Gb/core
 Platform_factor : 1.0
 Total-Tx        :     751.88 Kbps
 Total-Rx        :     751.62 Kbps
 Total-PPS       :      82.26  pps
 Total-CPS       :       2.73  cps

 Expected-PPS    :       0.00  pps
 Expected-CPS    :       0.00  cps
 Expected-L7-BPS :       0.00  bps

 Active-flows    :        1  Clients :        0   Socket-util : 0.0000 %
 Open-flows      :       18  Servers :        0   Socket :        0 Socket/Clients :  -nan
 drop-rate       :       0.00  bps
 current time    : 19.9 sec
 test duration   : 0.0 sec
4-5.pyファイルの中身
デフォルトで入っている astf/http_simple.py ファイルを確認してみます。
赤文字箇所が「3-4.yaml設定ファイルの中身」の赤文字箇所にそれぞれ対応しています。
[root@c77g127 trex]# vi astf/http_simple.py

from trex.astf.api import *


class Prof1():
    def __init__(self):
        pass

    def get_profile(self, **kwargs):
        # ip generator
        ip_gen_c = ASTFIPGenDist(ip_range=["16.0.0.0", "16.0.0.255"], distribution="seq")
        ip_gen_s = ASTFIPGenDist(ip_range=["48.0.0.0", "48.0.255.255"], distribution="seq")
        ip_gen = ASTFIPGen(glob=ASTFIPGenGlobal(ip_offset="1.0.0.0"),
                           dist_client=ip_gen_c,
                           dist_server=ip_gen_s)

        return ASTFProfile(default_ip_gen=ip_gen,
                            cap_list=[ASTFCapInfo(file="../avl/delay_10_http_browsing_0.pcap",
                            cps=1)])


def register():
    return Prof1()
またASTFモードでは「3-5.yaml設定ファイルのオプション」で紹介したオプションが無いようです。ASTFモードのPython APIも確認してみたのですが、該当する項目が見つからずでした。
特に「keep_src_port: true」のオプションについて、ある特定のケースにおいては必須となる機能だったりするので、もう少し調査してみようと思います。
5.その他便利機能
Trexコンソールの操作方法やPing, Pcap方法について解説していきます。
5-1.Trexコンソールの操作その1
「4-4.トラフィック印加」からの続きとして、Term1画面に統計情報の詳細を出力させます。
<出力例>
Term1画面にて「t」キーを押下。元の画面に戻すときは「0(ゼロ)」キーを押下。
                       |          client  |           server  |
 -----------------------------------------------------------------------------------------
       m_active_flows  |               2  |                2  |  active open flows
          m_est_flows  |               2  |                2  |  active established flows
         m_tx_bw_l7_r  |       5.64 Kbps  |      750.63 Kbps  |  tx L7 bw acked
   m_tx_bw_l7_total_r  |       5.64 Kbps  |      738.64 Kbps  |  tx L7 bw total
         m_rx_bw_l7_r  |     738.64 Kbps  |        5.64 Kbps  |  rx L7 bw acked
           m_tx_pps_r  |      14.43  pps  |       71.96  pps  |  tx pps
           m_rx_pps_r  |      74.88  pps  |       17.35  pps  |  rx pps
           m_avg_size  |         1.04 KB  |          1.06 KB  |  average pkt size
           m_tx_ratio  |       100.00  %  |        101.62  %  |  Tx acked/sent ratio
                    -  |             ---  |              ---  |
   m_traffic_duration  |     302.38  sec  |      302.38  sec  |  measured traffic duration
                    -  |             ---  |              ---  |
                  TCP  |             ---  |              ---  |
                    -  |             ---  |              ---  |
     tcps_connattempt  |             840  |                0  |  connections initiated
         tcps_accepts  |               0  |              840  |  connections accepted
        tcps_connects  |             840  |              840  |  connections established
          tcps_closed  |             838  |              838  |  conn. closed (includes drops)
       tcps_segstimed  |            2520  |             3360  |  segs where we tried to get rtt
      tcps_rttupdated  |            2520  |             3360  |  times we succeeded
          tcps_delack  |             840  |                0  |  delayed acks sent
        tcps_sndtotal  |            4200  |            21000  |  total packets sent
         tcps_sndpack  |             840  |            19320  |  data packets sent
         tcps_sndbyte  |          209160  |         26958960  |  data bytes sent by application
      tcps_sndbyte_ok  |          209160  |         26958960  |  data bytes sent by tcp
         tcps_sndctrl  |             840  |                0  |  control (SYN|FIN|RST) packets sent
         tcps_sndacks  |            2520  |             1680  |  ack-only packets sent
         tcps_rcvpack  |           20160  |             1680  |  packets received in sequence
         tcps_rcvbyte  |        26958960  |           209160  |  bytes received in sequence
      tcps_rcvackpack  |            1680  |             3360  |  rcvd ack packets
      tcps_rcvackbyte  |          209160  |         26958960  |  tx bytes acked by rcvd acks
   tcps_rcvackbyte_of  |             840  |             1680  |  tx bytes acked by rcvd acks - overflow acked
         tcps_preddat  |           18480  |                0  |  times hdr predict ok for data pkts
                    -  |             ---  |              ---  |
                  UDP  |             ---  |              ---  |
                    -  |             ---  |              ---  |
                    -  |             ---  |              ---  |
           Flow Table  |             ---  |              ---  |
                    -  |             ---  |              ---  |
       redirect_rx_ok  |              12  |               10  |  redirect to rx OK
5-2.Trexコンソールの操作その2
「4-4.トラフィック印加」からの続きとして、Term2画面に統計情報の詳細を出力させます。
Term2にて実行
tui
出力例
Term2にて出力
trex>tui

Global Statistitcs

connection   : 192.168.11.127, Port 4501             total_tx_L2  : 745.45 Kb/sec ▼▼
version      : ASTF @ v2.82                          total_tx_L1  : 758.43 Kb/sec ▼▼
cpu_util.    : 0.41% @ 1 cores (1 per dual port)     total_rx     : 745.45 Kb/sec ▼▼
rx_cpu_util. : 0.0% / 0.25 pkt/sec                   total_pps    : 81.12 pkt/sec ▼▼
async_util.  : 0.04% / 1.35 KB/sec                   drop_rate    : 0 b/sec
total_cps.   : 2.95 cps/sec                          queue_full   : 0 pkts

Port Statistics

   port    |         0         |         1         |       total
-----------+-------------------+-------------------+------------------
owner      |              root |              root |
link       |                UP |                UP |
state      |      TRANSMITTING |      TRANSMITTING |
speed      |            1 Gb/s |            1 Gb/s |
CPU util.  |             0.41% |             0.41% |
--         |                   |                   |
Tx bps L2  |      ▼ 13.5 Kbps |  ▼▼ 731.95 Kbps |    ▼▼ 745.45 Kbps
Tx bps L1  |   ▼▼ 15.62 Kbps |   ▼▼ 742.8 Kbps |    ▼▼ 758.43 Kbps
Tx pps     |    ▼▼ 13.27 pps |    ▼▼ 67.85 pps |      ▼▼ 81.12 pps
Line Util. |               0 % |            0.07 % |
---        |                   |                   |
Rx bps     |   ▼▼ 731.7 Kbps |     ▼ 13.75 Kbps |    ▼▼ 745.45 Kbps
Rx pps     |    ▼▼ 67.35 pps |    ▼▼ 13.77 pps |      ▼▼ 81.12 pps
----       |                   |                   |
opackets   |               213 |              1063 |              1276
ipackets   |              1063 |               213 |              1276
obytes     |             25955 |           1438624 |           1464579
ibytes     |           1438624 |             25955 |           1464579
tx-pkts    |          213 pkts |        1.06 Kpkts |        1.28 Kpkts
rx-pkts    |        1.06 Kpkts |          213 pkts |        1.28 Kpkts
tx-bytes   |          25.95 KB |           1.44 MB |           1.46 MB
rx-bytes   |           1.44 MB |          25.95 KB |           1.46 MB
-----      |                   |                   |
oerrors    |                 0 |                 0 |                 0
ierrors    |                 0 |                 0 |                 0

status:  -

Press 'ESC' for navigation panel...
status:

tui>
上記の出力となったら「ESC」キーを押下すると、画面下にナビゲーションパネルが表示。
Term2にて出力

browse:     'ESC' - console, 'q' - quit, 'd' - dashboard, 'u' - util, 't' - astf, 'l' - latency,
dashboard:  'n' - reset view, 'o' - owned ports, 'a' - all ports, 'c' - clear,
例えば、「t」キーを押下すると、以下の画面が出力されます。
Term2にて出力

Global Statistitcs

connection   : 192.168.11.127, Port 4501             total_tx_L2  : 774.93 Kb/sec ▼
version      : ASTF @ v2.82                          total_tx_L1  : 788.42 Kb/sec ▼
cpu_util.    : 0.36% @ 1 cores (1 per dual port)     total_rx     : 774.93 Kb/sec ▼
rx_cpu_util. : 0.0% / 0 pkt/sec                      total_pps    : 84.35 pkt/sec ▼
async_util.  : 0.04% / 1.36 KB/sec                   drop_rate    : 0 b/sec
total_cps.   : 2.8 cps/sec                           queue_full   : 0 pkts

Cpu Util(%)

  Thread   | Avg | Latest | -1  | -2  | -3  | -4  | -5  | -6  | -7  | -8  | -9  | -10 | -11 | -12 | -13 | -14
-----------+-----+--------+-----+-----+-----+-----+-----+-----+-----+-----+-----+-----+-----+-----+-----+----
 0  (0,1)  |   0 |      0 |   0 |   0 |   0 |   0 |   0 |   0 |   0 |   0 |   0 |   0 |   0 |   0 |   0 |   0

Mbuf Util

           |   64b   |  128b   |  256b   |  512b   |  1024b  |  2048b  |  4096b  |   9kb   | RAM(MB)
-----------+---------+---------+---------+---------+---------+---------+---------+---------+--------
Total:     |   81900 |   40950 |   16380 |   16380 |   16380 |   37879 |    1024 |    1024 |     130
Used:      |         |         |         |         |         |         |         |         |
Socket 0:  |     620 |    1258 |       1 |       0 |       0 |    1040 |       0 |       0 |       2
Percent:   |      0% |      3% |      0% |      0% |      0% |      2% |      0% |      0% |

status:  -

browse:     'ESC' - console, 'q' - quit, 'd' - dashboard, 'u' - util, 't' - astf, 'l' - latency,
ustats:
5-3.TrexコンソールからPing
以下コマンド実行後、NICの制御がKernelからDPDKに委譲されるため、bash上ではNICが見えなくなります。このため、Pingを打つ場合、TRexコンソール上から実行します。
./t-rex-64 -i --astf
「-p」でNICのポート番号*3を指定し、「-d」で宛先IPアドレスを指定します。
trex>ping -p 0 -d 192.168.7.1
出力例
Term2にて実行
trex>ping -p 0 -d 192.168.7.1

Pinging 192.168.7.1 from port 0 with 64 bytes of data:
Reply from 192.168.7.1: bytes=64, time=1.90ms, TTL=64
Reply from 192.168.7.1: bytes=64, time=0.83ms, TTL=64
Reply from 192.168.7.1: bytes=64, time=1.12ms, TTL=64
Reply from 192.168.7.1: bytes=64, time=1.97ms, TTL=64
Reply from 192.168.7.1: bytes=64, time=1.46ms, TTL=64
補足6
上記PingコマンドにてDUTとの疎通確認を行った後、負荷を印加した方が良いと考える方もいらっしゃると思います。しかし、何度かPingしてもダメなときは、とりあえず負荷を印加してみることをお勧めします。どのような条件のとき「Pingが飛ばなくても負荷をかけることができるのか」までは確認しきれていませんが、Pingが飛ばなくても負荷を印加できたケースがあったためです。*4
5-4.Trexコンソールからパケットキャプチャ
DPDKが動作しているため、当然ですがKernel上で動作するtcpdumpもできませんので、TRexコンソール上でパケットキャプチャを実施します。
trex>capture record start --tx 0 --rx 0 -l 10000
trex>capture record stop -i 1 -o /root/test.pcap
「--tx」と「--rx」でNICのポート番号を指定し、「-l」でPcapファイル数のリミットを指定。
「-i」はCapturing IDとなり、Pcap開始+停止毎にカウントアップする。「-o」で出力先パスとファイル名を指定。
出力例
Term2にて実行
Pcap開始
trex>capture record start --tx 0 --rx 0 -l 10000

Starting packet capturing up to 10000 packets                 [SUCCESS]

*** Capturing ID is set to '1' ***
*** Please call 'capture record stop --id 1 -o ' when done ***

Pcap停止&Pcapファイル出力
trex>capture record stop -i 1 -o /root/test.pcap

Stopping packet capture 1                                    [SUCCESS]

Writing up to 720 packets to '/root/test.pcap'               [SUCCESS]

Removing PCAP capture 1 from server                          [SUCCESS]
5-5.徐々に負荷を上げる方法
トラフィック印加後、「-m」オプションを任意に変更することで、徐々に負荷を上げることが可能です。
Term2にて実行
トラフィック印加開始
trex>start -f astf/http_simple.py -d 30 -m 1

途中から「-m」値を1→5に変更
trex>update -m 5
出力例
Term2にて出力
trex>update -m 5

Updating traffic.                                            [SUCCESS]
5-6.各種コンソールコマンド
出力例
Term2にて出力
trex>help

Console Commands:

capture -                      Manage PCAP captures
debug -                        Internal debugger for development.
events -                       Shows events log
help -                         Shows This Help Screen
history -                      Manage the command history
plugins -                      Show / load / use plugins
quit -                         Exit the console
tui -                          Shows a graphical console
verbose -                      Shows or set verbose mode

Common Commands:

acquire -                      Acquire ports
arp -                          Performs a port ARP resolution
clear -                        Clear cached local statistics
connect -                      Connects to the TRex server and acquire ports
disconnect -                   Disconnect from the TRex server
ipv6 -                         Configures IPv6 of a port
l2 -                           Configures a port in L2 mode
l3 -                           Configures a port in L3 mode
map -                          Maps ports topology
ns -                           Network namespace
ping -                         Pings the server / specific IP
pkt -                          Sends a Scapy format packet
portattr -                     Sets port attributes
reset -                        Reset ports
scan6 -                        Search for IPv6 neighbors
shutdown -                     Shutdown the server
stats -                        Show various statistics
vlan -                         Configures VLAN tagging for a port.

Advanced Stateful Commands:

latency -                      Latency-related commands
profiles -                     Get loaded to profiles information
service -                      Configures port for service mode.
start -                        Start traffic command
stop -                         Stop traffic command
template_group -               Template group commands
topo -                         Topology-related commands
update -                       Update traffic multiplier
以上です。
7.最後に
以下のサイトを参考にさせて頂きました。
https://trex-tgn.cisco.com/trex/doc/index.html
https://www.ciscolive.com/c/dam/r/ciscolive/emea/docs/2018/pdf/DEVNET-1120.pdf
実際に使い始めてみて、その良さを日々実感しています。
IXIAやAvalancheといった専用の測定装置には及ばない点がある一方で、サクッと性能を確認してみたいといったケースや、背景呼として使用したいといったケースには重宝すると思います。
また、公式Docはとても充実しているのですが、重要なポイントが点在して記載されている内容もあるため、必要な箇所だけをピックアップして使えるようにまとめました。
なお、<補足2>にも記載しましたが、よく使うディレクトリ内には多くのサンプルpyファイルが格納されているため、熟読されることを重ねてお勧めします。
次回は応用編とまではいかないですが、もう少し突っ込んだ利用方法について記載できればいいなと考えています。